
Written by Chadwick Dearing Oliver and Fatma Arf Oliver
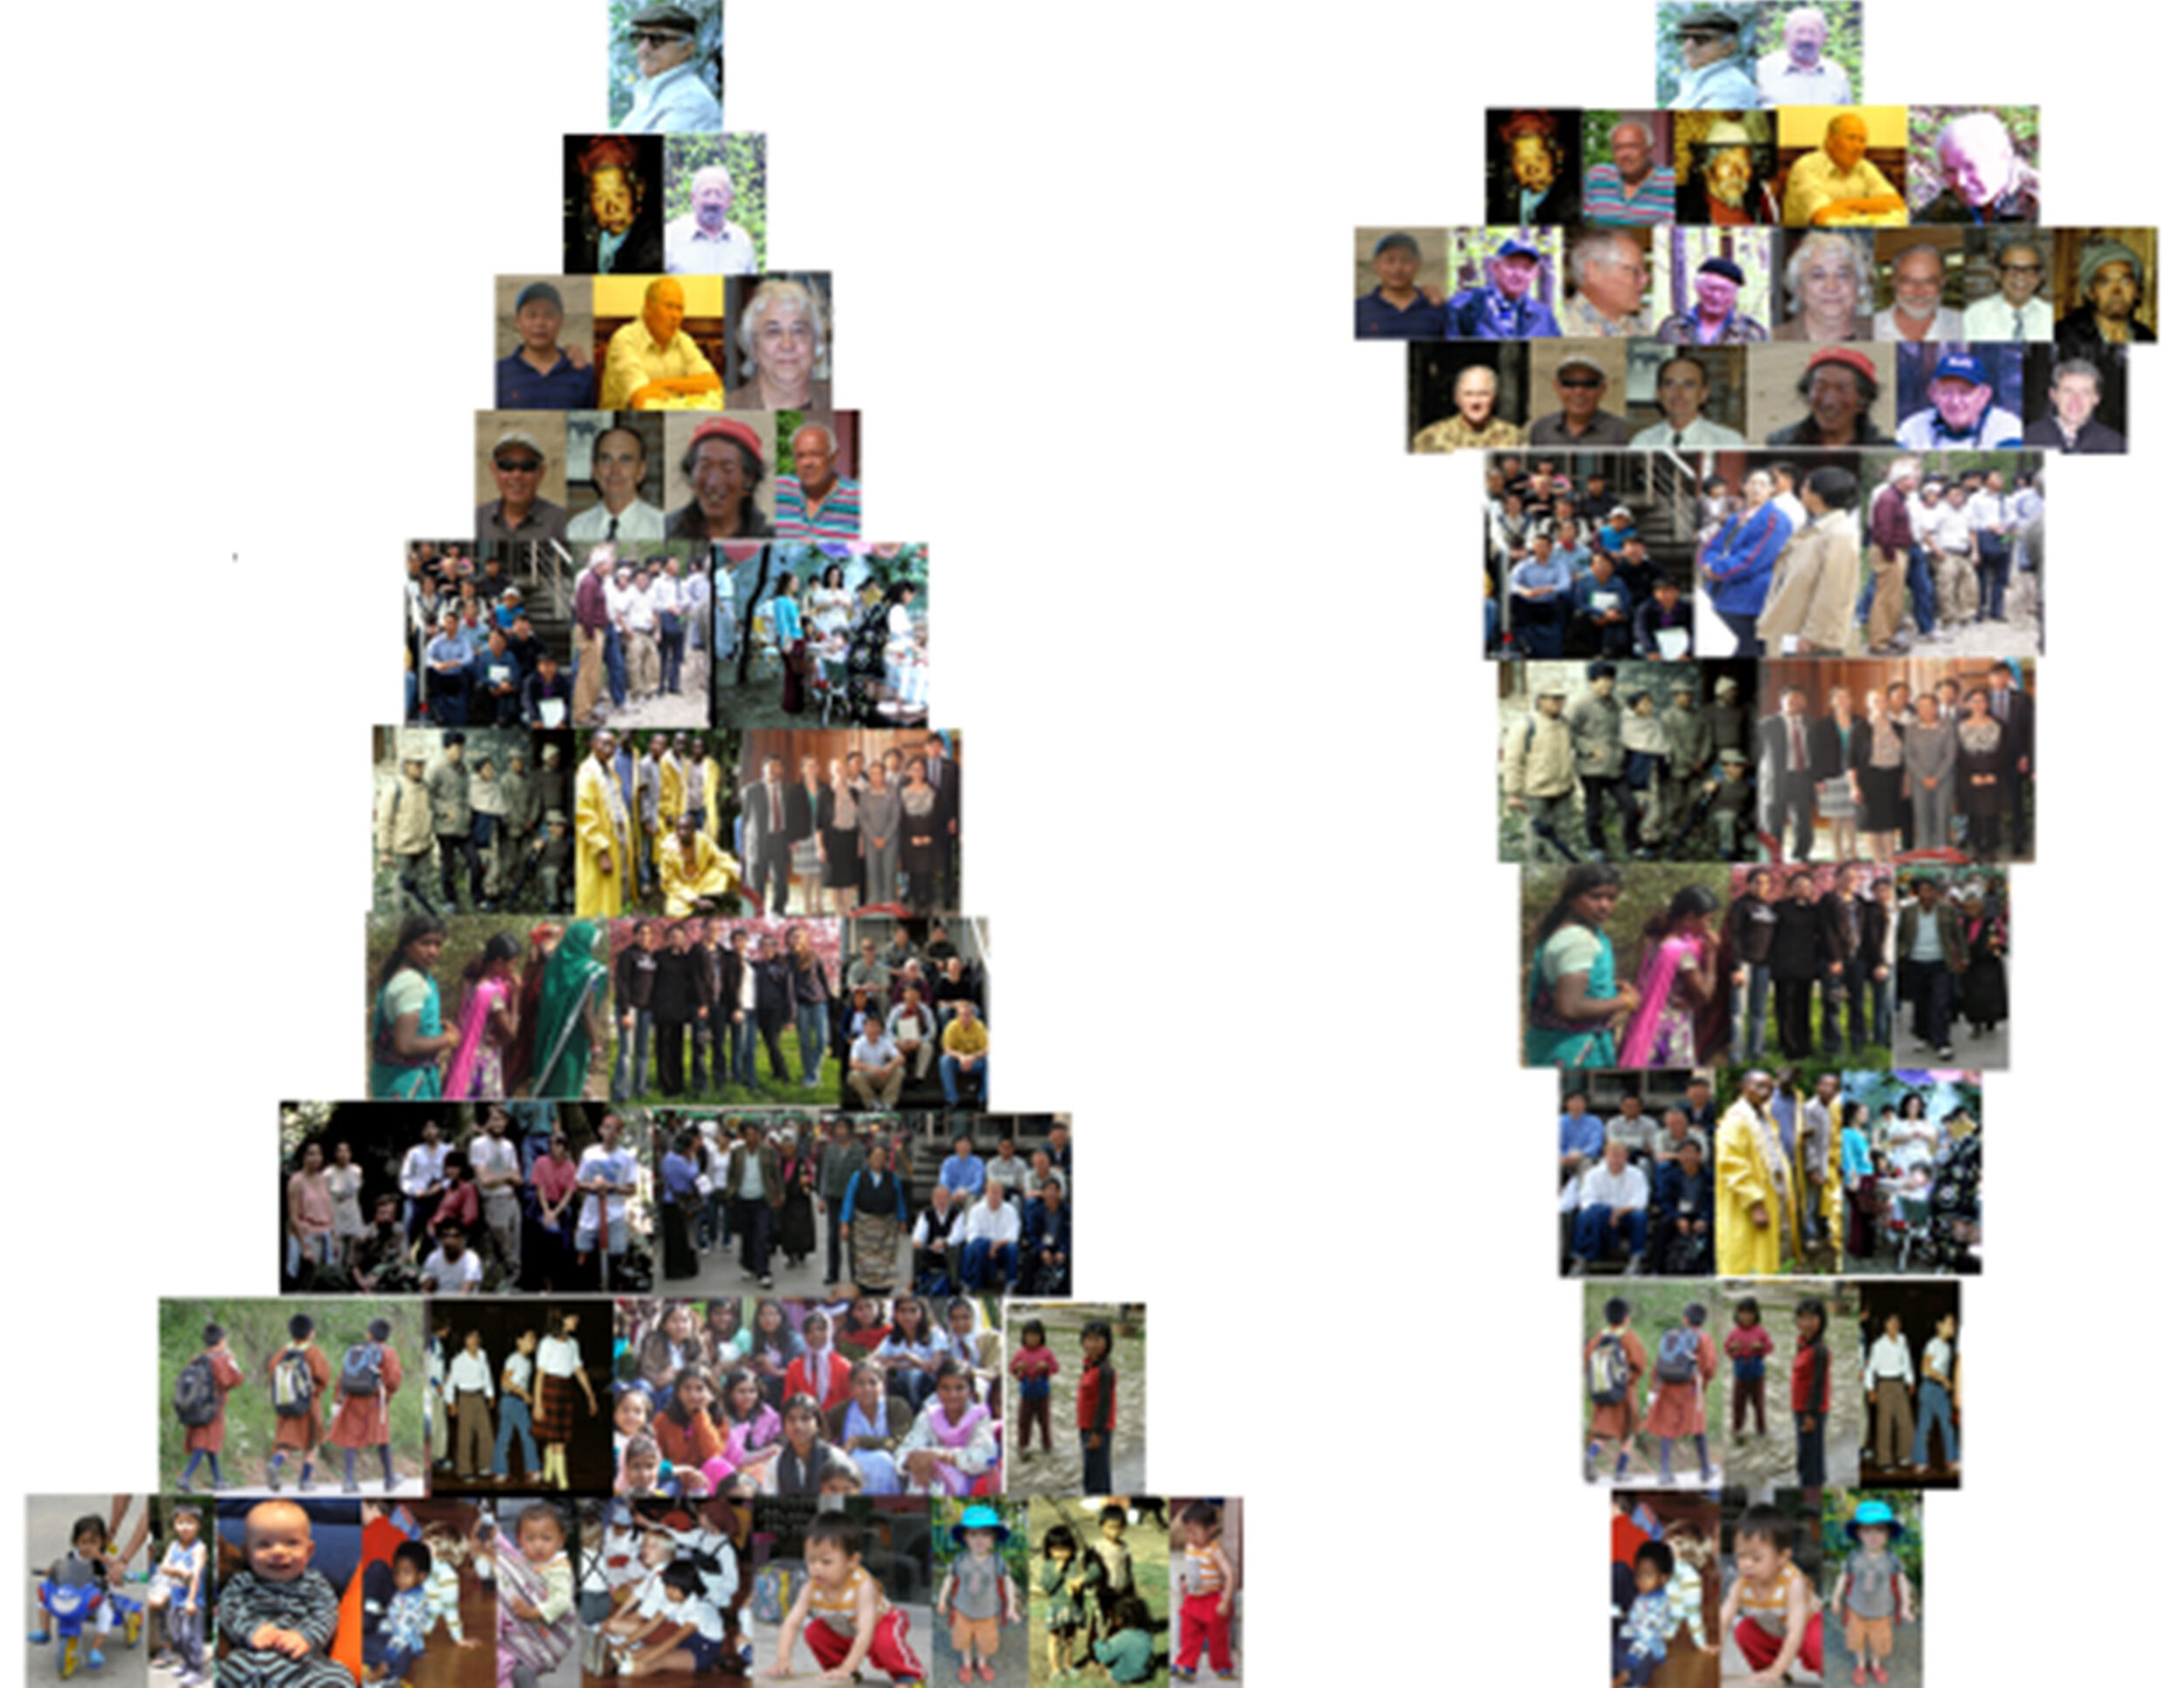
Traditional (left) and inverted population pyramids.
FERTILITY RATES, POPULATION PYRAMIDS, AND FUTURE POPULATIONS
The world population is approaching stability, despite past pessimism that people would ruin themselves through uncontrolled population growth. The changes will create tremendous opportunities if addressed appropriately. The fertility rate—number of births per female—has dropped from 5.0 in 1960 to 2.4 in 2016 and is approaching the “replacement” rate of 2.1 (no population growth; 1, 2, 3). The total population trend lags behind fertility rate by several decades; but by 2100 the world’s population should stabilize if the current decline in fertility rate continues. There are already noticeable effects of the reduced fertility.
Since 1960, the number of births per female has dropped from 5.0 to 2.4 and is approaching the “replacement” rate of 2.1.

Figure 1. Changes in fertility rates by global regions from 1960 to 2017 (2, after 1).
There will still be temporal and spatial “hot-spots” of high and low fertility, but these can be anticipated and addressed without causing some of the current suffering, migration, and refugee issues.
Much of the environmental movement has been based on concern of human overpopulation (4, 5, 6). The fertility rate was about four when these concerns were recently expressed (Figure 1).
The accelerating population also led to concerns of resource shortages—insufficient water, energy (fossil fuels), minerals, food, and forests. These and earlier concerns then led to competition for resources, hoarding, and wars.
Temporal and spatial hot-spots of high and low fertility can be anticipated and addressed.
For many reasons probably including grass-roots education (e.g., Planned Parenthood), alarmist rhetoric (4, 5, 6), scientific understanding of human reproduction, changes in lifestyles, and social security so children are less needed to care for elderly parents, an extremely high world population probably will not occur. There are and will be sufficient amounts of all resources provided we share them and the fertility rates continue declining (1).
Populations and how to manage them can be understood through a series of factors described below. Two countries at opposite ends of the spectrum--Nigeria and Japan—will be used as examples.

Figure 2. “Population pyramid” of Nigeria in 1953 (center red) 2020 (outside) showing increased population. Juveniles, adults, and elderly are described in text (data from 7).
Population pyramids. Population patterns show the number of females and males in each 5-year age class for a given year (Figure 2). Females age classes are conventionally stacked on the right and males, on the left. Each 5-year age class changes every year as the newborn age class is included into the 0-5-year class and shifts a year’s population into the next older age class. The term “population pyramid” was coined when the high fertility rates in most countries created “pyramid” shapes.
The youngest age classes (here defined as people less than 20-years old) are generally referred to as “juvenile.” Those age classes older than “juvenile” and less than about 65 or 75 are generally considered “adult.” And those older than “adult” are considered “elderly” (Figure 2); however, names and age ranges of the three groups may vary by country and analysis. Each group has unique needs: juveniles need caring and education; adults need jobs and independent places to live, work, and raise families; and elderly—like juveniles—need care, but of different kinds. These unique needs strongly affect society.

Figure 3. Schematic prediction of future sizes of older age classes, as described in the text.
Population predictability decades into the future. The world’s population for a given year is “set” at the end of that year and becomes quite predictable for the next 75+ years as the age classes move upwards (Figure 3). The number of people born in future years is less predictable, and is based on future fertility rates.
Each year the population changes through birth, in which new people are added to the youngest age class, and deaths, which are subtracted from any age class. Until recently, death has been high in juveniles, especially in the youngest (0-5 year) age class. Death in adults generally occurs from diseases, drugs, or violence (e.g., war or murder). Death in elderly people is generally from accumulations of diseases and bodily degeneration. Modern public health and medicine is reducing deaths in juveniles and adults and enabling elderly people to live longer.
Fertility rates. The initial size of each age class is determined by the “fertility rate” of the females, calculated as the number of babies born in a year divided by the total population of females—even though the actual “childbearing age” is only part of that. A “fertility” rate of 2.1 (or sometimes 2.08) offspring per female is considered “stable,” because two children would be produced to replace both the mother and the father and the extra “0.1 children” would account for some females having no children.
Once a low fertility rate becomes instilled in a country, later pressures have difficulty changing it.
A low fertility rate seems to be an acquired, cultural phenomenon, not genetic. Low fertility generally first seems to occur in countries with high education and socioeconomic conditions. Once a low fertility rate becomes instilled in a country, later pressures such as war or economic stress have difficulty changing it.
THE WORLD’S FUTURE POPULATION PATTERNS

Figure 4. World population pattern in 2015 (front, red graph) and 2050 (back graph), showing anticipated changes in populations of different ages, described in the text (from 1, 7).
The world as a whole will continue to feel increasing population pressures for about another 50 years despite the fertility rate decline.
Figure 4 shows the world’s population distribution in 2015 superimposed on the projected distribution in 2050. Assuming that future fertility rates remain close to replacement, there will be about the same number of people less than 30 years old at both times. Consequently, most places will not need additional juvenile and young adult facilities (playgrounds, preschools, schools, colleges, and teachers ); only replacements will be needed except where there is already a shortage. Adults and elderly will have a proportionally smaller number of juveniles to care for than in the past.
The world will continue to feel increasing population pressures for about another 50 years, despite the fertility rate decline.
A bigger issue will be the dramatically increased number of adults trying to enter the job market, find housing and office space, and have a dignified life. Competition will be high even among the educated. Elderly people will also increase dramatically because they will live longer and there will be more people in age classes becoming elderly. This increased elderly care will offset the fewer juveniles to care for.
Most places will not need additional juvenile and young adult facilities.
When or if the population at all age classes becomes stable and all countries reach a developed capacity, the constantly increasing demand for resources and infrastructure will decline. Any increase will largely reflect people’s migrations and technological innovations. New economic and business models will be needed that are not based on scarcity or expanding markets.
POPULATION PATTERN VARIATIONS AMONG COUNTRIES
The overall world pattern of Figure 4 masks dramatically different population characteristics among countries. Countries such as Nigeria and other parts of Africa have the pyramid shape (Figure 2) associated with currently high birth rates. Central America had this birth rate and pyramid shape until about 30 years ago. The increasing number of young people straining the country infrastructures probably contribute to the large number of Central Americans trying to enter North America and Africans trying to enter Europe.
Pyramid-shaped populations: Pyramid-shaped populations generally have both a “housing shortage” and a profit for elderly people when they sell their homes (and move to apartments or assisted living). The “housing shortage” has fueled economies and the “profit” from selling their houses helped elderly people pay for their assisted living.
Inverted pyramid population shape: Many economically well-developed countries in Europe and east Asia have very low fertility rates that result in an inverted pyramid shape to their population (Figure 5). The “housing shortage” is not a strong factor in the economy. Such countries are concerned with having insufficient young people both to maintain the countries’ infrastructures and to care for the proportionately larger number of elderly.

Figure 5. Inverted pyramid population shape of Japan in 2019 (left) and projected for 2050 (right), assuming a continued low fertility rate (from 7).
Figure 5. Inverted pyramid population shape of Japan in 2019 (left) and projected for 2050 (right), assuming a continued low fertility rate (from 7).
Columnar population shape: Perhaps most desirable is a “columnar”-shaped population, with nearly equal people in each age class. Countries already in this shape are rare and include China and the USA. China has achieved this shape because of low fertility rates during the Cultural Revolution (1966-1976) and later policy of one child per family. The United States actually has a low fertility rate (1.8 in 2018) but a liberal immigration policy that maintains the population shape.

Figure 6. Population patterns of the United States (left) and China (right) approaching columnar shapes, for different reasons (from 1, 7).
WAYS TO MANAGE POPULATIONS
We can always expect fluctuations in fertility rates in countries; however, we can do several things to ease burdens created by the individual countries’ population distributions described above and by fluctuations. Our actions can be done separately or in concert; and the actions will depend on the shape of the population:
Countries can adjust their cultures and infrastructures to their changing populations, just as people in the “baby boom” in the United States and western Europe from about 1946-1964 adjusted to situations that were different from their parents. Similarly, the world will need to adjust to the expanding adult class through creation of more housing and jobs as well as possibly becoming accustomed to more crowded conditions (Figure 4).
Countries with expanding populations (e.g., Figure 2):
1. We can reduce the fertility rates of the few remaining countries with high fertility rates. The high fertility is a cultural norm, and can be changed through learning. This change can help in the long term more than the short term.
2. Wars to reduce the human population would not be effective, besides being horribly inhumane and against international laws (genocide). Even the devastation of World War II (60-85 million people killed; 8) would only reduce the world’s current population by one percent.
The current strife in countries with high fertility rates is caused by poor infrastructures more than by overcrowding.

Figure 7. Population densities in countries with expanding populations are not necessarily greater than in other countries; however, strife in expanding populations is often because of lack of infrastructure to accommodate the expansion (11).
3. We can increase the secondary manufacture (9)—and thus the number of jobs—in countries with high fertility rates. Countries with high fertility are not necessarily disadvantaged because the people are more crowded (Figure 7) or lacking resources compared to more prosperous, low fertility countries. They are largely lacking infrastructures, probably because they were formerly explicit or de facto colonies of other countries that exported their raw resources (10). Increased secondary manufacture will probably have three effects:
i. it will reduce the unemployment and thus increase the ability to provide food, clothing, and shelter;
ii. it will reduce the pressure to immigrate or seek refuge in other countries;
iii. it may change the lifestyles and lower the fertility rate.
4. We can encourage emigration, discussed below.
Countries with contracting populations (e.g., Figure 5),
A slight contraction of the global population would probably ease the pressure on the world’s resources and environment; however, some countries are contracting extraordinarily rapidly. Actions to alleviate contracting populations include:
1. We can increase the fertility rate. Women having a third child is sometimes advocated in some countries. The result would be a large population of juveniles—and later adults, then elderly—to be fed, employed, and cared for (Figure 8, left); and, the world population would become even more crowded. It may be possible to encourage a slight rise in fertility (Figure 8, right); however, other solutions exist.
All women having a third child would result in a large population of juveniles—and later adults, then elderly—to be fed, employed, and cared for.

Figure 8. Japan used as a hypothetical example of 30 years (2020-2050) of 3-child families (left) and 2.1-child families (right).
2. We can raise the retirement age to create relief from caring for large populations of elderly retired people—even with only a 5-year raise.
3. Inviting immigrants is already being done in some places; and we could increase the scope, especially from countries with an expanding population. The invitees could be of targeted age classes. It would be a mistake to invite only skilled people as immigrants, because often the vacant jobs demand less skill (a.k.a. “lesser jobs”); skilled workers would simply compete with people already in the inviting country; less skilled people often have less rigid mental models and so approach lesser jobs with creative ideas that increase the jobs’ efficiency (and profitability) and erase the jobs’ stigma; and, skilled workers are needed in their home countries to create a secondary manufacturing infrastructure described above. Cultural assimilation of the immigrants requires careful attention and will be addressed in a later blog.
It would be a mistake to invite only skilled people as immigrants.
4. We could invite “guest workers.” “Temporary” immigrants are sometimes invited to work in a wealthy country needing more labor. Especially when only one sex (usually males) is invited, the immediate effects can be cruel—families are separated and living/working conditions of the guest workers may be harsh. In the broader perspective, needed money (“remittance”) is sent back to families in the guest workers’ countries; and the “guest workers” learn skills and different cultural norms in the host countries. Sometimes, the guest workers return home with new money, skills, and perspectives; at other times, the guests’ families immigrate to the host countries and become citizens and assimilate, creating more diverse cultures.
Summary thoughts
The above stabilization of fertility rate, followed by a stable and then declining world population is not guaranteed. It will depend on continuation of the present trends for declining fertility rates. And, the time when the world population stabilizes will depend on how soon a stable fertility rate is reached. Furthermore, how little strife occurs in the meantime will depend on the decisions we make.
References
1. C.D. Oliver and F.A. Oliver. Global Resources and the Environment. (Cambridge University Press, 2018)
2. The World Bank, Fertility rate, total (births per woman). (2019 The World Bank) Accessed August 28, 2019. https://data.worldbank.org/indicator/SP.DYN.TFRT.IN The Economist. 2019. The UN revises down its population forecast. June 22, 2019.
3. The Economist. 2019. The UN revises down its population forecast. June 22, 2019.
4. T. Malthus. 1798. An Essay on the Principle of Population. J. Johnson in St. Paul’s church-Yard. 126 pp.
5. Helfrich, H.W. 1970. Issues in the Environmental Crisis. 1970. Yale University Press.
6. Donella H. Meadows, Dennis L. Meadows, J.Randers, W. W. Behrens III. 1972. The Limits To Growth. Signet.
7. US Census Bureau. Mid-Year Population for Five Year Age Groups: US Department of Commerce; 2016 [cited 2016 July1 ]. Available from: www.census.gov/population/international/data/idb/region.php?N=%20Results%20&T=10&A=separate&RT=0&Y=2016&R=-1&C=AU,CH,GT,IN,AE,US.
8. World War 2. World War II Casualties. (Oct. 4, 2009) Accessed August 28, 2019. https://worldwar2-database.blogspot.com/2010/10/world-war-ii-casualties.html
9. D. Acemoglu, J. Robinson. Why Nations Fail: The Origins of Power, Prosperity, and Poverty. (Crown Business; 2012).
10. T. Burgis. The Looting Machine: Warlords, Oligarchs, Corporations, Smugglers, and the Theft of Africa's Wealth. (PublicAffairs; 2015).
11. The World Bank. World Development Indicators: The World Bank; 2016 [May 8, 2016]. Available from: http://data.worldbank.org/indicator/EG.USE.PCAP.KG.OE.